Note
Click here to download the full example code
natural scene decoding ophys
This is an example of how to decode natural images from ophys traces in V1
First, let’s download an experiment from the Allen Institute Brain Observatory
from allensdk.core.brain_observatory_cache import BrainObservatoryCache

boc = BrainObservatoryCache()

OEID = 541206592
nwb_dataset = boc.get_ophys_experiment_data(OEID)
Next, we’ll load the dF/F traces and put them in a DataFrame
timestamps, dff = nwb_dataset.get_dff_traces()
neuron_ids = nwb_dataset.get_cell_specimen_ids()

import pandas as pd
traces = pd.DataFrame(
    dff.T,
    columns=neuron_ids,
    index=timestamps,
)

print(traces.head())
Out:
541510267  541510270    ...      541509957  541511118
10.30338   0.219740   0.151908    ...       0.360267   0.156850
10.33655   0.167939   0.142997    ...       0.308192   0.108658
10.36972   0.136697   0.068048    ...       0.295819   0.033781
10.40289   0.157216   0.105795    ...       0.329818   0.098048
10.43606   0.130490   0.097038    ...       0.487283   0.066526

[5 rows x 154 columns]
Next, we’ll load stim_table
stim_table = nwb_dataset.get_stimulus_table('natural_scenes')
print(stim_table.head())
Out:
frame  start    end
0     92  16126  16133
1     27  16134  16141
2     52  16141  16148
3     37  16149  16156
4    103  16156  16163
The stim_table lists stimulus times in terms of the start and end frames of the calcium traces, but we need start times and durations for neuroglia, so we’ll need to reshape
stim_table['time'] = timestamps[stim_table['start']]
stim_table['duration'] = timestamps[stim_table['end']+1] - stim_table['time']

print(stim_table.head())
Out:
frame  start    end       time  duration
0     92  16126  16133  545.22975   0.26537
1     27  16134  16141  545.49512   0.26538
2     52  16141  16148  545.72733   0.26537
3     37  16149  16156  545.99270   0.26538
4    103  16156  16163  546.22491   0.26538
Reduce the traces to responses
import numpy as np
from neuroglia.epoch import EpochTraceReducer

reducer = EpochTraceReducer(traces,func=np.mean)
X = reducer.fit_transform(stim_table)
y = stim_table['frame'].values
Do some dimensionality reduction on the responses
from sklearn.decomposition import PCA
pca = PCA()
X_reduced = pca.fit_transform(X)
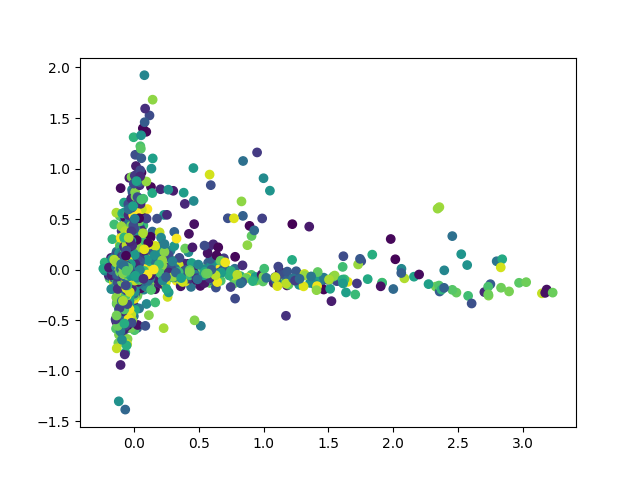
Plot the first two Principal Components
import matplotlib.pyplot as plt
plt.scatter(X_reduced[:,0],X_reduced[:,1],c=y)
Total running time of the script: ( 8 minutes 35.657 seconds)